


Video
Please add snipstock.com in the final credits

Views
44
Downloads
0
File Size
7.35 MB
Date Added
Aug 28, 2024
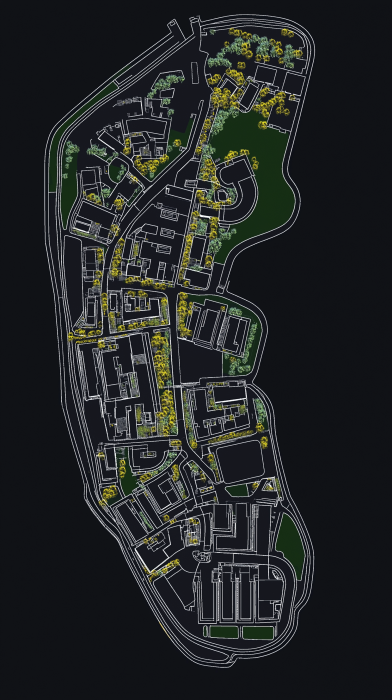
Description
A detailed scientific diagram depicting temperature analysis in a neighborhood from a top-down perspective. The simulation software creates a visual representation of the varying temperatures experienced in different areas.